

Sampling in One Minute
Sampling means studying a properly selected part of a population and using it to understand the whole population.
1. Meaning and Need for Sampling
A business may want to know the average life of all bulbs produced in a factory. Testing every bulb would be costly, slow and destructive. So, a smaller representative group is tested and the result is used to judge the full production.
Why do we use sampling?
- The population may be too large or infinite.
- A complete enquiry may require too much time and money.
- Testing may destroy the item, such as bulb-life or strength testing.
- A smaller enquiry can be supervised more carefully.
- Decisions may be needed quickly.
Three stages of a sampling problem
2. Four Basic Principles of a Sample Survey
Statistical Regularity
A fairly large sample selected at random tends, on average, to represent the population.
Inertia of Large Numbers
Other things remaining the same, larger samples generally give more stable and reliable results.
Optimisation
Select the design that gives the required accuracy at minimum cost, or maximum accuracy for the available cost.
Validity
The design must permit valid estimation and valid testing of population parameters.
3. Sampling or Census?
A census studies every unit of the population. A sample survey studies only selected units.
| Basis | Sample Survey | Census |
|---|---|---|
| Coverage | Selected units | Every unit |
| Time | Usually faster | Usually slower |
| Total cost | Usually lower | Usually higher |
| Sampling error | Present | Absent |
| Non-sampling error | Possible | Possible |
| Destructive testing | Suitable | Not possible |
| Information on every unit | Not available | Available |
Prefer Sampling When
- The population is very large.
- Testing is destructive.
- Time and cost are limited.
Prefer Census When
- The population is small.
- Every individual unit must be known.
- Missing one defect can be dangerous.
4. Errors in a Survey
Sampling Error
It arises because only a part of the population is studied.
- Defective sampling design
- Substitution of selected units
- Faulty definition of sampling units
- Wrong choice of statistic
- High variability in the population
Non-Sampling Error
It arises from collection, response, recording or measurement problems.
- Non-response or incomplete coverage
- Wrong measurement or recording
- Memory failure or incorrect answers
- Enumerator or respondent bias
- Communication gap
5. Essential Terms
The complete collection of all units under study.
The total number of units in the population.
A representative part selected from the population.
The number of units included in the sample.
The basic unit selected, such as a person, household, machine or product.
A complete and updated list of all sampling units.
Types of Population
| Type | Meaning | Example |
|---|---|---|
| Finite | Contains a countable number of units | Students in a college |
| Infinite | Contains unlimited or practically uncountable units | Future production of bulbs |
| Existent | Consists of real units | Workers in a factory |
| Hypothetical | Exists only conceptually | Outcomes from unlimited coin tosses |
6. Parameter, Statistic and Statistical Inference
| Concept | Meaning | Examples |
|---|---|---|
| Parameter | A numerical characteristic of the population | Population mean μ, population variance σ², population proportion P |
| Statistic | A numerical measure calculated from sample observations | Sample mean x̄, sample variance s², sample proportion p |
7. Sampling Distribution and Standard Error
7.1 Sampling Fluctuation
Suppose a class has ten students with different marks. If we select three students at random, the sample mean will depend on which three students are selected. Another sample of the same size may contain different students and therefore give a different mean.
Example: Why do sample means change?
Consider a population consisting of the marks:
40, 45, 50, 55, 60, 65, 70, 75, 80, 85
| Sample | Selected Marks | Sample Mean |
|---|---|---|
| Sample A | 40, 50, 60 | 50 |
| Sample B | 65, 75, 85 | 75 |
| Sample C | 45, 60, 80 | 61.67 |
The population is the same and the sample size is also the same. Only the selected units are different. Therefore, the sample means are different.
7.2 Sampling Distribution
To understand a sampling distribution, let us continue with the same example.
Step 1 – Start with the Population
| Student | Marks |
|---|---|
| A | 20 |
| B | 30 |
| C | 40 |
| D | 50 |
These four students together form the population. We now draw every possible sample of size 2 (without replacement).
Step 2 – Calculate the Sample Mean
| Sample | Marks | Sample Mean (x̄) |
|---|---|---|
| AB | 20,30 | 25 |
| AC | 20,40 | 30 |
| AD | 20,50 | 35 |
| BC | 30,40 | 35 |
| BD | 30,50 | 40 |
| CD | 40,50 | 45 |
Notice that we are interested in the sample means, not the original marks.
Step 3 – Count the Frequency
| Sample Mean | Frequency |
|---|---|
| 25 | 1 |
| 30 | 1 |
| 35 | 2 |
| 40 | 1 |
| 45 | 1 |
| Total | 6 |
Step 4 – Convert Frequency into Probability
Probability = Frequency ÷ Total Number of Samples
| Sample Mean | Frequency | Probability |
|---|---|---|
| 25 | 1 | 1/6 |
| 30 | 1 | 1/6 |
| 35 | 2 | 2/6 = 1/3 |
| 40 | 1 | 1/6 |
| 45 | 1 | 1/6 |
| Total | 6 | 1 |
7.3 Simple Random Sampling (SRS)
Simple Random Sampling means that every unit of the population has an equal chance of being selected.
Suppose a box contains five chits marked A, B, C, D and E. If every chit has an equal chance of being selected, the method is Simple Random Sampling.
| Abbreviation | Full Form | Meaning |
|---|---|---|
| SRS | Simple Random Sampling | Every unit has an equal chance of selection. |
| SRSWR | Simple Random Sampling With Replacement | The selected unit is returned before the next draw. |
| SRSWOR | Simple Random Sampling Without Replacement | The selected unit is not returned before the next draw. |
7.4 SRS With Replacement (SRSWR)
Under sampling with replacement, the selected unit is put back into the population before the next selection.
Example: Three units, sample size two
Population: A, B and C. Draw a sample of size 2 with replacement.
Because the first selected unit is returned, the same unit may appear again.
AA, AB, AC, BA, BB, BC, CA, CB, CC
7.5 SRS Without Replacement (SRSWOR)
Under sampling without replacement, the selected unit is kept aside and cannot be selected again in the same sample.
Example: Three units, sample size two
Population: A, B and C. Draw a sample of size 2 without replacement.
If order is ignored, the possible samples are:
AB, AC, BC
If order is considered, AB and BA are different ordered selections. In CA Foundation questions, follow the wording and formula expected in the question.
| Point | With Replacement | Without Replacement |
|---|---|---|
| Selected unit returned? | Yes | No |
| Same unit can appear again? | Yes | No |
| Population size after each draw | Remains unchanged | Decreases |
| Nature of successive draws | Independent | Dependent |
| Mean SE formula | σ / √n | Uses finite population correction |
7.6 Standard Error
When we drew different samples from the same population, we noticed that the sample mean was not always the same.
| Sample | Sample Mean (x̄) |
|---|---|
| AB | 25 |
| AC | 30 |
| AD | 35 |
| BC | 35 |
| BD | 40 |
| CD | 45 |
Different samples give different estimates. The next question is:
This variation is measured by the Standard Error (SE).
Small Standard Error
Suppose five different samples produce these sample means:
60, 61, 59, 60, 62
All the values are very close to each other. This means different samples give almost the same answer.
Large Standard Error
Now suppose another survey gives these sample means:
42, 68, 55, 79, 49
The values are widely spread. Different samples produce very different answers.
The standard deviation of the sampling distribution of a statistic is called the Standard Error of that statistic. In ICAI MCQs, this may be stated briefly as: Standard Error is the standard deviation of a statistic.
Sample Proportion
Sometimes we are interested in the average (mean). At other times we are interested in the proportion or percentage of items having a particular characteristic.
Example: Out of 100 bulbs, 10 are defective.
Population proportion of defective bulbs:
P = 10/100 = 0.10 (10%)
If a sample of 20 bulbs contains 3 defective bulbs, then
Sample Proportion (p) = 3/20 = 0.15 (15%)
Different samples may give different sample proportions. Therefore, the sample proportion also has a Standard Error.
| Statistic Being Estimated | Sampling Method | Standard Error Formula |
|---|---|---|
| Sample Mean (x̄) | SRSWR | SE(x̄) = σ / √n |
| Sample Mean (x̄) | SRSWOR | SE(x̄) = (σ / √n) × √[(N − n)/(N − 1)] |
| Sample Proportion (p) | SRSWR | SE(p) = √(PQ / n) |
P = Population proportion having the characteristic
Q = 1 − P
n = Sample Size
7.7 Meaning of the Symbols
| Symbol | Meaning |
|---|---|
| N | Population size |
| n | Sample size |
| σ | Population standard deviation |
| P | Population proportion possessing the characteristic |
| Q | 1 − P |
| SE(x̄) | Standard error of sample mean |
| SE(p) | Standard error of sample proportion |
7.8 Why does sample size reduce Standard Error?
For the sample mean under SRSWR:
SE(x̄) = σ / √n
Since √n appears in the denominator, increasing n reduces standard error.
Example: Effect of sample size
Let population standard deviation σ = 20.
| Sample Size | Calculation | Standard Error |
|---|---|---|
| n = 25 | 20 / √25 | 4 |
| n = 100 | 20 / √100 | 2 |
| n = 400 | 20 / √400 | 1 |
When the sample size becomes four times, the standard error becomes half.
7.9 Finite Population Correction
When sampling is done without replacement from a finite population, each selected unit reduces the uncertainty about the remaining population. Therefore, standard error becomes smaller.
The correction factor is:
√[(N − n)/(N − 1)]
Example: Standard error without replacement
Population size N = 100, sample size n = 20 and population standard deviation σ = 15.
7.10 Number of Possible Samples
The number of possible samples depends on whether sampling is done with replacement or without replacement.
Without Replacement
Suppose a population contains 6 persons:
A, B, C, D, E and F
We want to select a sample of 2 persons. Since sampling is without replacement, the same person cannot be selected twice. Also, the order of selection does not create a new sample.
AB and BA contain the same two persons. Therefore, they are counted as one sample, not two.
Method 1 – List the Possible Samples
| Starting Person | Possible Samples | Number |
|---|---|---|
| A | AB, AC, AD, AE, AF | 5 |
| B | BC, BD, BE, BF | 4 |
| C | CD, CE, CF | 3 |
| D | DE, DF | 2 |
| E | EF | 1 |
| Total | 5 + 4 + 3 + 2 + 1 = 15 |
Therefore, the total number of possible samples is 15.
Method 2 – Combination Formula
When the order of selection does not matter, the number of possible samples is calculated using the combination formula:
| Concept | Does order matter? | Simple illustration |
|---|---|---|
| Permutation | Yes | AB and BA are different arrangements. |
| Combination | No | AB and BA contain the same two persons, so they form one sample. |
NCn = N! / [n!(N − n)!]
The symbol ! is called factorial. It means multiplying a whole number by every positive whole number below it until 1.
Examples:
3! = 3 × 2 × 1 = 6
4! = 4 × 3 × 2 × 1 = 24
5! = 5 × 4 × 3 × 2 × 1 = 120
How to Simplify Factorials Quickly
Do not expand every factorial fully. Expand only until the common factorial in the numerator and denominator can be cancelled.
Example: Simplify 6! ÷ 4!
6! / 4! = (6 × 5 × 4!) / 4! = 6 × 5 = 30
In this example:
- N = 6 (population size)
- n = 2 (sample size)
6C2 = 6! / [2!(6 − 2)!]
= 6! / (2! × 4!)
= (6 × 5 × 4 × 3 × 2 × 1) / [(2 × 1) × (4 × 3 × 2 × 1)]
The common terms 4 × 3 × 2 × 1 appear in both the numerator and denominator, so they cancel out.
= (6 × 5) / (2 × 1)
= 30 / 2
= 15
Without replacement and when order does not matter, number of possible samples = NCn.
8. Three Broad Groups of Sampling Methods
Sampling methods are grouped according to how the units are selected. Before learning the individual methods, first identify the broad group to which the method belongs.
Probability Sampling
Selection is based on chance. Every unit has a known, non-zero chance of being selected.
Memory rule: Lottery systemNon-Probability Sampling
Selection is not based on chance. The investigator decides which units will be included.
Memory rule: Investigator decidesMixed Sampling
Two or more sampling methods are combined to suit the practical needs of the study.
Memory rule: Best of both9. Probability Sampling and Its Types
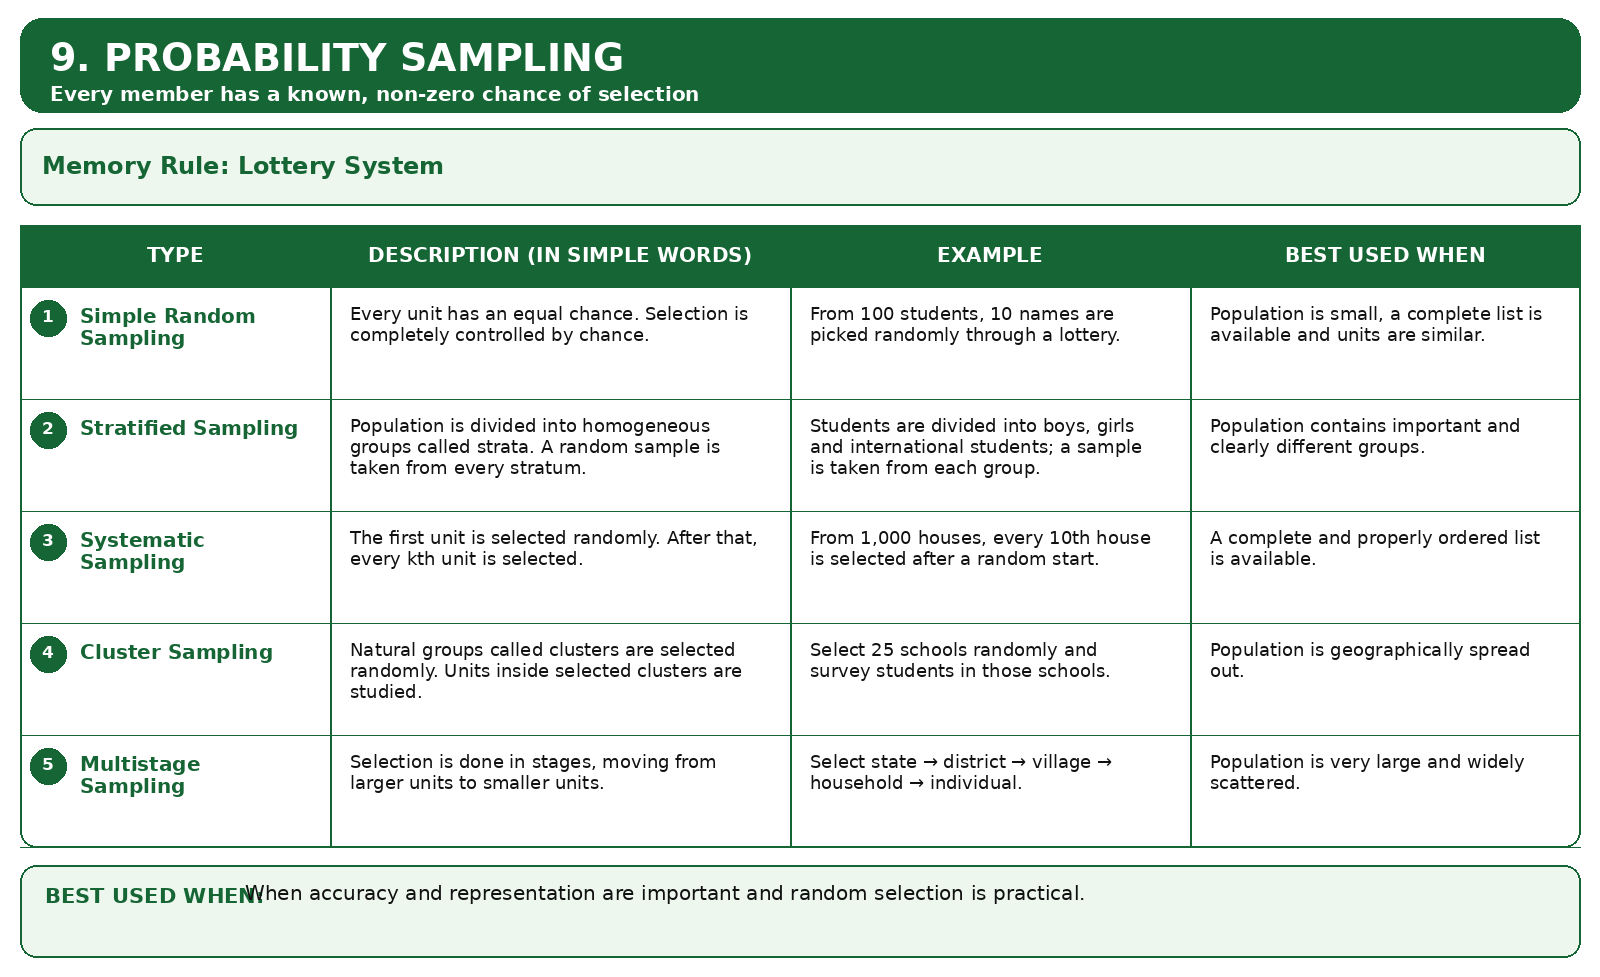
In probability sampling, every member of the population has a known and non-zero chance of being selected. The investigator does not personally choose the units. Selection is controlled by a random process, such as a lottery or computer-generated random numbers.
9.1 Simple Random Sampling
Every unit of the population has an equal chance of selection. The choice is made completely by chance through a lottery, random-number table or computer-generated random numbers.
Simple Example
A class has 100 students. Ten roll numbers are picked through a lottery. Since every student had the same chance of being selected, this is simple random sampling.
9.2 Stratified Sampling
When a population contains clearly different groups, it is first divided into internally similar groups called strata. A random sample is then selected separately from every stratum.
Simple Example
A college contains boys, girls and international students. Students are selected randomly from each group so that every important group is represented.
- Proportional or Bowley allocation: the sample taken from each stratum is proportional to the size of that stratum.
- Neyman allocation: the sample taken from a stratum depends on both its population size and its standard deviation, so a larger or more variable stratum receives a larger sample.
| Allocation | Formula | Meaning |
|---|---|---|
| Bowley / Proportional | nh = n × (Nh / N) | Sample from each stratum is proportional only to its population size. |
| Neyman | nh = n × [NhSh / Σ(NhSh)] | Sample depends on both stratum size and variability. |
9.3 Systematic Sampling
The first unit is selected randomly. After that, every kth unit is selected from an ordered list.
Sampling interval: k = N ÷ n
Simple Example
From a list of 1,000 houses, a sample of 100 houses is required. The interval is 1,000 ÷ 100 = 10. If House No. 6 is selected randomly first, the sample will contain Houses 6, 16, 26, 36 and so on.
9.4 Cluster Sampling
Instead of selecting individual units from the entire population, the population is divided into natural groups called clusters. Some clusters are selected randomly, and the units within the selected clusters are studied.
Simple Example
To study school students across Maharashtra, 25 schools are selected randomly and all students in those schools are surveyed. Each school is a cluster.
9.5 Multistage Sampling
Selection is carried out in a series of stages, moving from larger units to smaller units. A sample is selected at every stage until the final units are reached.
Simple Example
To study unemployment in India: select states, then districts, then villages, then households and finally individuals.
State → District → Village → Household → Individual
10. Non-Probability Sampling and Its Types
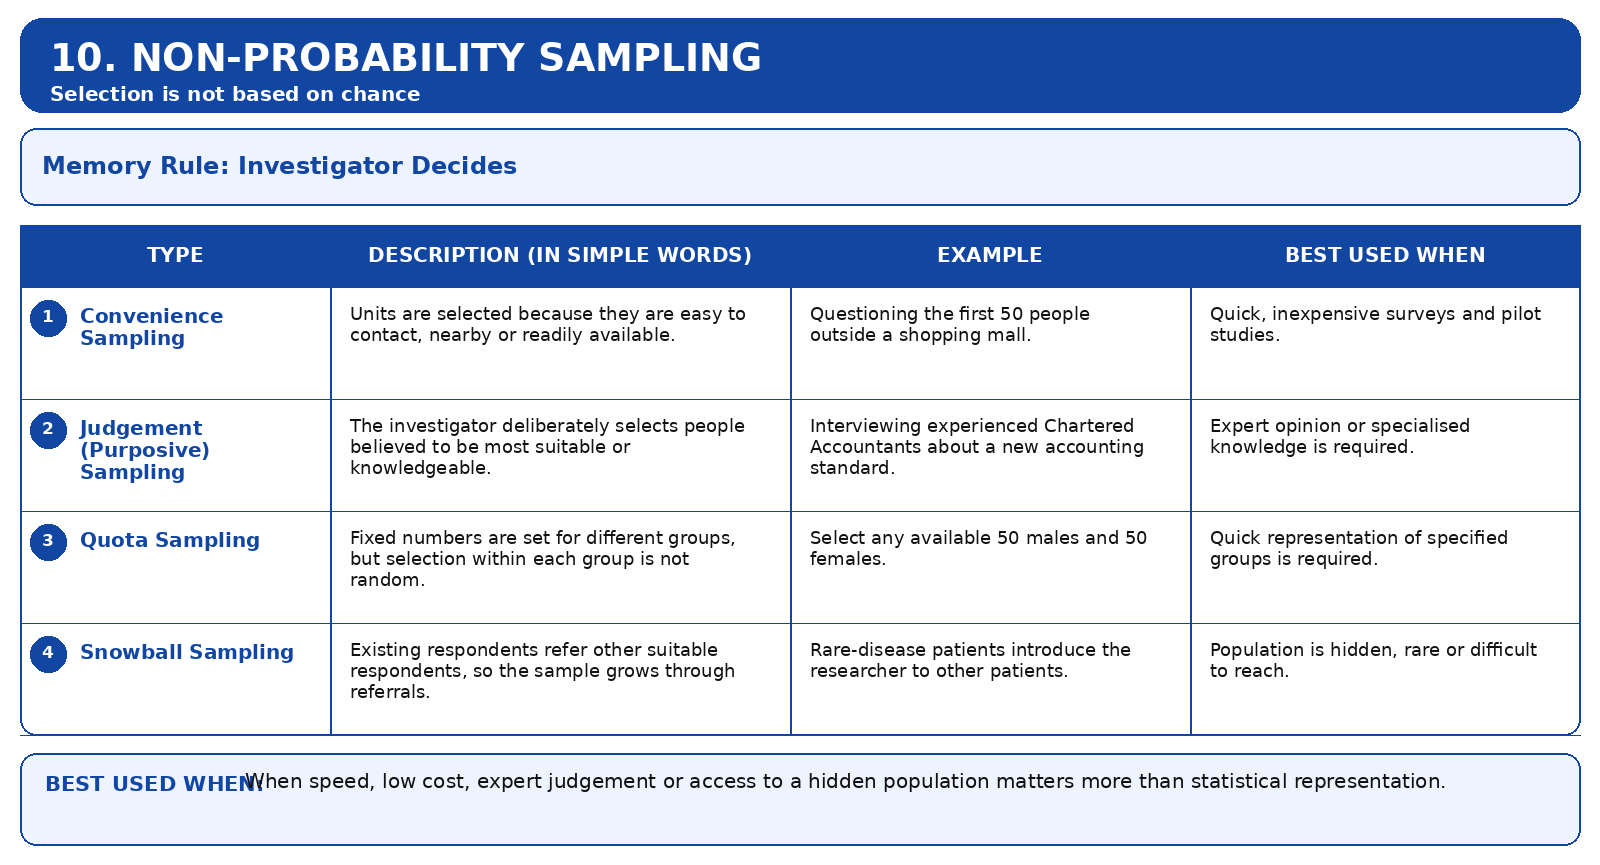
In non-probability sampling, selection is not controlled by chance. The investigator, interviewer or existing respondents influence who is included. Therefore, some members of the population may have no chance of being selected.
10.1 Convenience Sampling
The investigator selects units that are easiest to contact, readily available or located nearby.
Simple Example
An interviewer stands outside a shopping mall and questions the first 50 people who agree to respond.
10.2 Judgement or Purposive Sampling
The investigator deliberately chooses people who are believed to be the most knowledgeable, experienced or suitable for the purpose of the study.
Simple Example
Only experienced Chartered Accountants are interviewed to understand the practical effect of a new accounting standard.
10.3 Quota Sampling
The investigator fixes the required number of respondents from different groups. However, the persons chosen within each group are selected according to convenience or judgement, not randomly.
Simple Example
A survey requires 50 males and 50 females. The interviewer may choose any available 50 males and any available 50 females.
10.4 Snowball Sampling
The study begins with a few respondents. Each respondent refers the investigator to other suitable respondents, and the sample gradually grows through referrals.
Simple Example
A researcher studying patients with a rare disease begins with one patient, who introduces another patient, who then refers more patients.
11. Mixed Sampling and Its Types
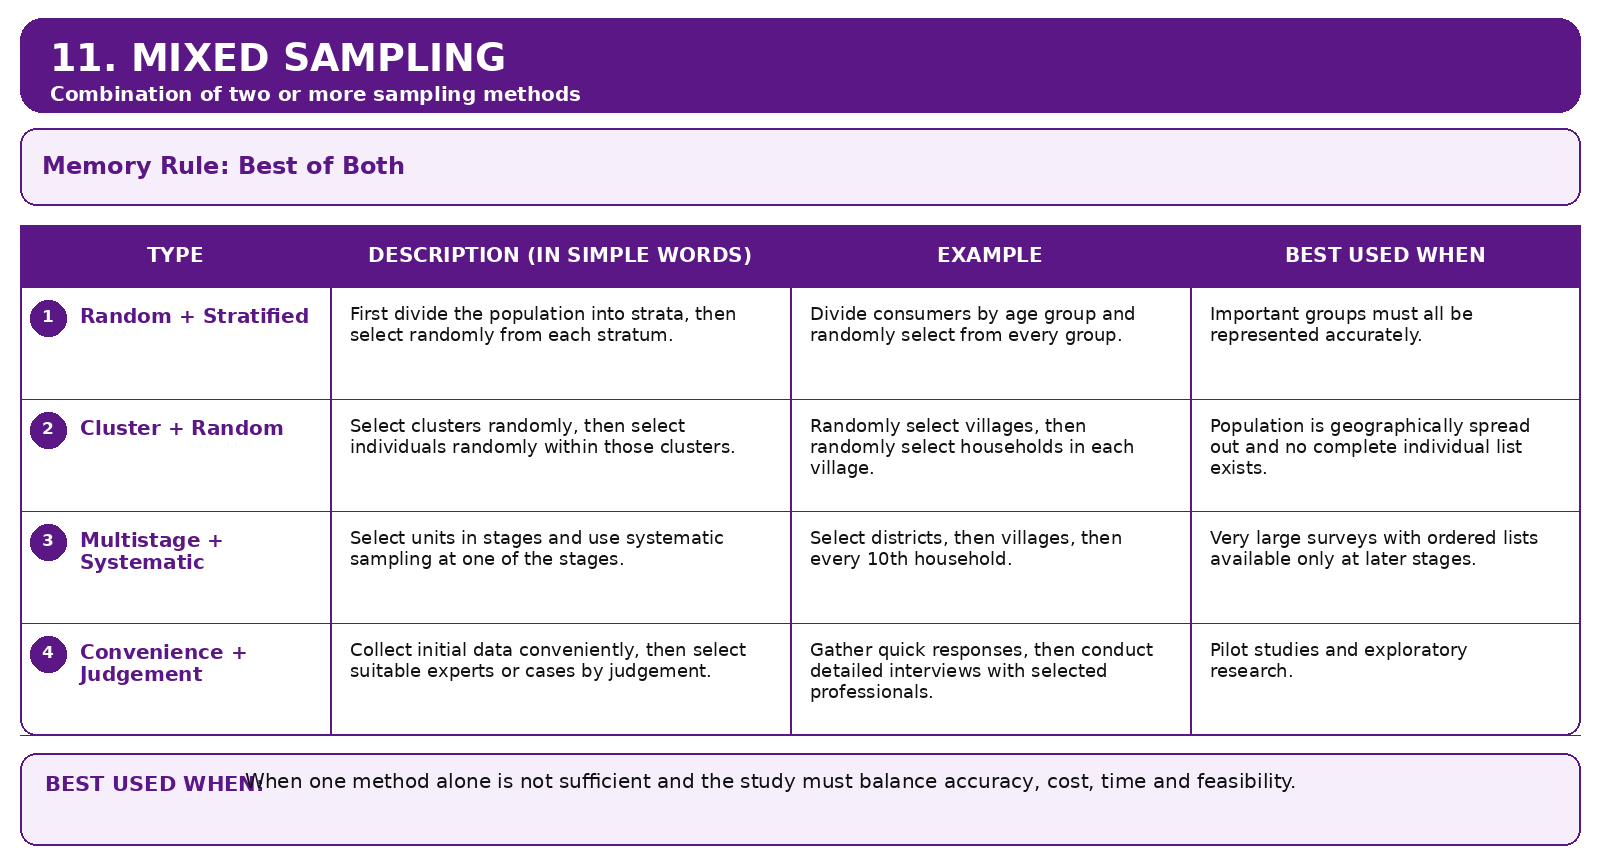
In practical research, one method may not satisfy every requirement. Mixed sampling combines two or more methods to balance accuracy, geographical coverage, time, cost and feasibility.
11.1 Random and Stratified Sampling
The population is first divided into strata. A random sample is then selected from each stratum.
Simple Example
Consumers are divided into age groups, and respondents are selected randomly from every age group.
11.2 Cluster and Random Sampling
Clusters are first selected randomly. Individual units are then selected randomly from within the chosen clusters.
Simple Example
Villages are selected randomly, and households are then selected randomly from each chosen village.
11.3 Multistage and Systematic Sampling
Selection is carried out through several stages, and systematic sampling is used at one of those stages.
Simple Example
Select districts, then villages, and then select every 10th household from an ordered household list.
11.4 Convenience and Judgement Sampling
Convenience sampling is first used to collect information quickly. Judgement sampling is then used to select the most relevant or knowledgeable respondents for deeper study.
Simple Example
Initial responses are gathered quickly from available participants. Experienced professionals are then selected for detailed interviews.
Quick Comparison of the Three Groups
| Group | Who controls selection? | Main strength | Main limitation |
|---|---|---|---|
| Probability Sampling | Chance or random process | More representative and supports statistical inference | May require more time, planning and a proper sampling frame |
| Non-Probability Sampling | Investigator or respondents | Quick, inexpensive and practical | More prone to bias; selection probabilities are unknown |
| Mixed Sampling | Combination of methods | Balances accuracy and practicality | Must be carefully designed to avoid combining the weaknesses of different methods |
12. ICAI MCQ Decoder
Most ICAI questions in this unit do not require long calculations. They test whether the student can recognise one exact word, distinction or formula. Use the following tables as a question-decoding guide.
12.1 Identify the Method from the Clue
| Clue in the Question | Correct Method | Reason |
|---|---|---|
| Lottery, random numbers, equal chance | Simple Random Sampling | Every unit has the same probability of selection. |
| Population divided into groups; random sample from every group | Stratified Sampling | Every important stratum is represented. |
| Random start followed by every 5th, 10th or kth unit | Systematic Sampling | Selection follows a fixed sampling interval. |
| Schools, villages or city blocks selected as complete groups | Cluster Sampling | Natural groups rather than scattered individuals are selected. |
| State → District → Village → Household | Multistage Sampling | Selection is completed in successive stages. |
| First available or easiest respondents | Convenience Sampling | Accessibility controls selection. |
| Experts or specially suitable persons deliberately selected | Judgement / Purposive Sampling | The sampler uses personal discretion. |
| Fixed number from each category, but persons are not randomly selected | Quota Sampling | Only the quota is fixed; selection within it is non-random. |
| One respondent refers another | Snowball Sampling | The sample grows through referrals. |
12.2 Most Common ICAI Confusions
| Do Not Confuse | Correct Distinction |
|---|---|
| Random and haphazard | Random is a planned probability process; haphazard is careless selection. |
| Parameter and statistic | Parameter describes population; statistic is calculated from sample observations. |
| Sampling distribution and population data | Sampling distribution contains possible values of a statistic and their probabilities. |
| Sampling error and standard error | Sampling error is the difference arising from using a sample; standard error measures the usual sampling variation and precision. |
| Stratified and quota sampling | Both form groups, but stratified uses random selection within each group; quota does not. |
| Cluster and stratified sampling | Stratified selects from every stratum; cluster sampling selects only some clusters. |
12.3 One-Line Strength and Limitation
| Method | Main Strength | Main Limitation / Trap |
|---|---|---|
| Simple Random | Simple and free from personal selection bias | Needs a complete frame; best when population is reasonably homogeneous. |
| Stratified | Represents every important group and gives segment-wise estimates | Needs correct formation of strata. |
| Systematic | Quick, economical and easy to operate | Hidden periodicity can create serious bias. |
| Cluster | Economical for geographically scattered populations | Selected clusters may differ considerably from one another. |
| Multistage | Flexible for very large surveys | Design and analysis can become complex. |
| Convenience | Fast and inexpensive | Usually not representative. |
| Judgement | Useful for expert or specialised enquiries | Subjective and dependent on the sampler's discretion. |
| Quota | Ensures specified numbers from groups | Selection within groups remains non-random. |
| Snowball | Reaches rare or hidden populations | Referral networks may produce bias. |
12.4 Direct Answer Rules
Concept Rules
- Unknown population decision → Sample observations.
- Parameter → Population characteristic.
- Statistic → Function of sample observations.
- Sampling fluctuation → Variation in values of a statistic.
- Sampling distribution → Probability distribution of a statistic.
- Measure of precision → Standard Error.
Calculation Rules
- With replacement → Nn.
- Without replacement → NCn.
- Sample size rises → Standard Error falls.
- Bowley allocation → Population size.
- Neyman allocation → Population size × Standard deviation.
- Every kth unit → Systematic sampling.
13. Worked Examples
Example 1: Number of Samples
A population has 5 units and a sample of 3 units is drawn without replacement.
Example 2: With Replacement
A population has 3 units and samples of size 2 are drawn with replacement.
Example 3: Systematic Sample
A list contains 1,000 customers and a sample of 100 is required.
If the random start is 6, the selected units are 6, 16, 26, 36 and so on.
Sampling — One Page Recall
- Study a representative part to understand the whole.
- Useful when population is very large or infinite.
- Saves time and total cost.
- Essential in destructive testing.
- Supports quicker business decisions.
- Population → complete group.
- Sample → selected representative part.
- Statistic → numerical measure from sample.
- Inference → estimate or decision.
- Parameter → numerical measure of population.
- Statistical Regularity.
- Inertia of Large Numbers.
- Optimisation.
- Validity.
- Memory code: RIOV.
- Sampling studies selected units.
- Census studies every unit.
- Sampling is faster and usually cheaper.
- Census has no sampling error.
- Both may suffer non-sampling error.
- Sampling error: caused by studying only a part.
- Non-sampling error: response, recording or measurement problem.
- Sampling error occurs only in sampling.
- Non-sampling error occurs in both sampling and census.
- Population size = N.
- Sample size = n.
- Sampling unit = unit selected.
- Sampling frame = complete updated list.
- Population may be finite, infinite, existent or hypothetical.
- Different samples may give different statistic values.
- This variation is sampling fluctuation.
- Sampling distribution contains all possible values of a statistic.
- SRSWR returns the selected unit; SRSWOR does not.
- Standard error measures precision and falls as sample size rises.
- n! means n × (n − 1) × ... × 1.
- Special rule: 0! = 1.
- With replacement: Nn.
- Without replacement: NCn.
- Combination is used because order does not matter.
- Every unit has a known, non-zero chance.
- Simple random: equal chance.
- Stratified: random sample from every stratum.
- Systematic: random start, then every kth unit.
- Cluster and multistage suit large scattered populations.
- Selection is not governed by known probabilities.
- Convenience: easiest available units.
- Judgement: investigator chooses suitable units.
- Quota: fixed group numbers, but no random selection.
- Snowball: respondents refer other respondents.
- Mixed sampling combines two or more methods.
- Distinct groups → Random + Stratified.
- Geographical clusters → Cluster + Random.
- Large staged survey → Multistage + Systematic.
- Pilot study → Convenience + Judgement.